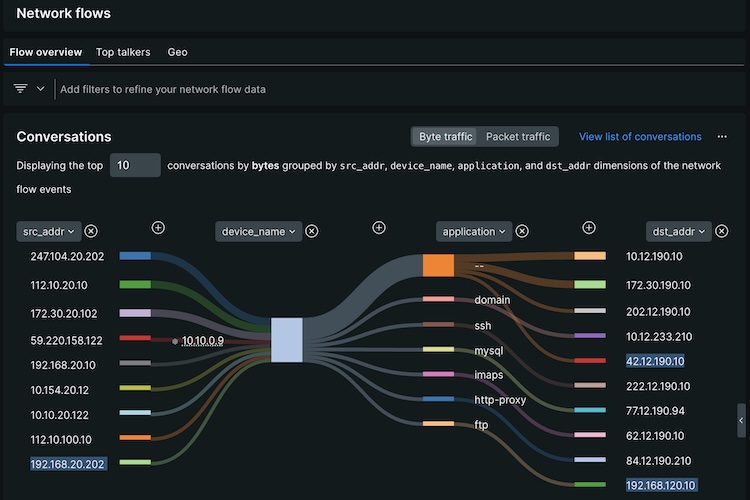
In the fast-paced world of mobile app development, ensuring performance and reliability is paramount. Integrating monitoring tools such as New Relic not only helps in keeping track of your application’s health but also optimizes the user experience. In this article, we’ll walk through integrating New Relic into a Flutter application backed by a Python server and see how to monitor it using New Relic One.
Clone the Repository
The first step to getting started is to clone the source repositories, which include both the Flutter application and the Python backend. Open your terminal and execute the following command:
git clone https://github.com/andibaso/todoist-flutter.git
git clone https://github.com/andibaso/todoist-python.git
Step 2: Run the Application
With the repositories cloned, navigate into your Flutter project’s directory and set up the environment. Ensure you have both Flutter and Dart installed on your machine. Enter the following commands:
cd todoist-flutter
flutter pub get
flutter run
Additionally, start your Python backend as follows:
cd ../todoist-python
pip install -r requirements.txt
python manage.py runserver
Make sure that all the necessary packages are installed both for Flutter and Python to ensure seamless interaction between the mobile app and its backend.
Add New Relic Integration into Mobile
Now that your application is up and running, it’s time to integrate New Relic for monitoring. New Relic allows you to gain insights into your application’s performance by offering various metrics and visualizations.
-
Sign Up/In at New Relic: If you haven’t already, create an account at New Relic.
-
Generate API Keys: Navigate to ‘Account Settings’ and generate your API key needed for integration.
-
Install New Relic Mobile Monitoring Library: Add the New Relic Flutter package to your
pubspec.yamlin your Flutter project:
  dependencies:
    newrelic_flutter_agent: ^1.0.0
Run flutter pub get to install the package.
- Modify Main Entry Point: Edit your
main.dartentry point to initialize New Relic:
  import 'package:flutter/material.dart';
  import 'package:newrelic_flutter_agent/newrelic_flutter_agent.dart';

  void main() {
    NewRelic.init('<your-api-key>');
    runApp(MyApp());
  }
Replace <your-api-key> with your actual New Relic API Key.
- Add Custom Metrics and Events: Utilize the New Relic API to record custom events, errors, and performance metrics throughout the application lifecycle as needed.
Step 4: Monitoring Result with New Relic One
With the integration complete, it’s time to start monitoring your application performance using New Relic One:
-
Access New Relic One Dashboard: Navigate to the New Relic One dashboard and locate your application.
-
Observe Real-time Metrics: Analyze metrics such as app load time, error rates, throughput, and memory usage which will be visible within the dashboard.
-
Set Up Alerts: Configure alerts to notify you of critical conditions or thresholds, ensuring proactive management of your app’s health.
-
Explore Reports and Insights: Dive into detailed reports and explore various insights to optimize the performance and reliability of your Flutter application.
The integration of New Relic provides invaluable data points that contribute to better decision-making concerning optimizations and user experience improvements.
Mobile monitoring is crucial and New Relic offers a robust solution to get clarity on app performance straight to your fingertips. By following these steps, you can enhance your monitoring setup quickly and efficiently, ensuring that your users receive the best possible experience!

 Complete Guide to Network Simulation and Monitoring with New Relic