This guide provides a comprehensive step-by-step setup for monitoring network data using New Relic, leveraging Docker containers and simulation tools. It outlines the configuration process for SNMP and network flow monitoring, ensuring a robust framework for data analysis and infrastructure management.
Configure Your New Relic License and User Key
To initiate monitoring with New Relic, commence by setting up your account credentials. Execute the following commands to export your account ID, license key, region, and user key:
export NR_ACCOUNT_ID=XXXXXXX
export NR_LICENSE_KEY=XXXXXXXXXXXXXXXXXXXXXXXXXXXXXXXXFFFFNRAL
export NR_REGION=US
export NR_USER_KEY=XXXX-XXXXXXXXXXXXXXXXXXXXXXXXXXX
Device Monitoring
Step 1: Install Docker Dependencies
Begin by installing Docker dependencies needed for network monitoring. Add Docker’s official GPG key and set up the repository with these commands:
# Add Docker's official GPG key:
sudo apt-get update
sudo apt-get install ca-certificates curl
sudo install -m 0755 -d /etc/apt/keyrings
sudo curl -fsSL https://download.docker.com/linux/debian/gpg -o /etc/apt/keyrings/docker.asc
sudo chmod a+r /etc/apt/keyrings/docker.asc

# Add the repository to Apt sources:
echo \
  "deb [arch=$(dpkg --print-architecture) signed-by=/etc/apt/keyrings/docker.asc] https://download.docker.com/linux/debian \
  $(. /etc/os-release && echo "$VERSION_CODENAME") stable" | \
  sudo tee /etc/apt/sources.list.d/docker.list > /dev/null
sudo apt-get update

sudo apt-get install docker-ce docker-ce-cli containerd.io docker-buildx-plugin docker-compose-plugin
Step 2: Install jq
jq is a lightweight and flexible command-line JSON processor. Install it using:
sudo echo "deb http://us.archive.ubuntu.com/ubuntu vivid main universe" >> /etc/apt/sources.list
sudo apt-get update
sudo apt-get install jq -y
Step 3: Configure Docker
Adjust your Docker settings for optimal performance:
sudo usermod -aG docker $USER
sudo systemctl start docker
sudo chmod 666 /var/run/docker.sock
docker swarm init
Step 4: Create Docker Network
Create a Docker network to simulate devices and connect them effortlessly:
docker network create -d overlay --subnet=10.10.0.0/24 --attachable testnet
Step 5: Simulate Devices
Use Docker containers to simulate three network devices. Download and run preconfigured images using the following commands:
docker run -d --name=cisco-router --restart=always --network=testnet --privileged -v /:/rootfs:ro -v /etc/localtime:/etc/localtime:ro -v ./files/cisco-router:/usr/local/snmpsim/data tandrup/snmpsim
docker run -d --name=cisco-switch --restart=always --network=testnet --privileged -v /:/rootfs:ro -v /etc/localtime:/etc/localtime:ro -v ./files/cisco-switch:/usr/local/snmpsim/data tandrup/snmpsim
docker run -d --name=linksys-router --restart=always --network=testnet --privileged -v /:/rootfs:ro -v /etc/localtime:/etc/localtime:ro -v ./files/linksys-router:/usr/local/snmpsim/data tandrup/snmpsim
Step 6: Inspect Your Created Network
Verify the configuration of your Docker network:
docker network inspect testnet
Step 7: Create SNMP Base Configuration
Utilize the ktranslate Docker image to set up your initial SNMP base configuration:
docker pull kentik/ktranslate:v2
id=$(docker create kentik/ktranslate:v2)
docker cp $id:/etc/ktranslate/snmp-base.yaml .
docker rm -v $id
chmod 646 snmp-base.yaml
Step 8: Inspect the Base Configuration
Check the configuration file to ensure it meets your requirements:
vi snmp-base.yml
Step 9: Run Discovery Profile
Initiate a discovery operation in your network:
docker run -ti --name ktranslate-discovery --rm --net=testnet \
  --user `id -u`:`id -g` \
  -v `pwd`/snmp-base.yaml:/snmp-base.yaml \
  kentik/ktranslate:v2 \
  -snmp /snmp-base.yaml \
  -log_level info \
  -snmp_discovery=true
SStep 10: Running the ktranslate Agent*
Now it’s time to run the ktranslate agent to collect and send SNMP data to New Relic. Use the following command, which configures various parameters such as compression, logging, and data formatting:
docker run -d --name ksnmp --restart unless-stopped --net=testnet \
  -v `pwd`/snmp-base.yaml:/snmp-base.yaml \
  -e NEW_RELIC_API_KEY=$NR_LICENSE_KEY \
  kentik/ktranslate:v2 \
    -snmp /snmp-base.yaml \
    -compression=gzip \
    -sinks=new_relic \
    -nr_account_id=$NR_ACCOUNT_ID \
    -log_level=info \
    -metrics=jchf \
    -tee_logs=true \
    -max_flows_per_message=100 \
    -listen=0.0.0.0:8183 \
    -metalisten=0.0.0.0:8184 \
    -format=new_relic_metric \
    -nr_region=$NR_REGION \
    -service_name=ksnmp
**Step 11 : Inspect the logs to ensure that everything is functioning correctly: **
docker container logs ksnmp -f
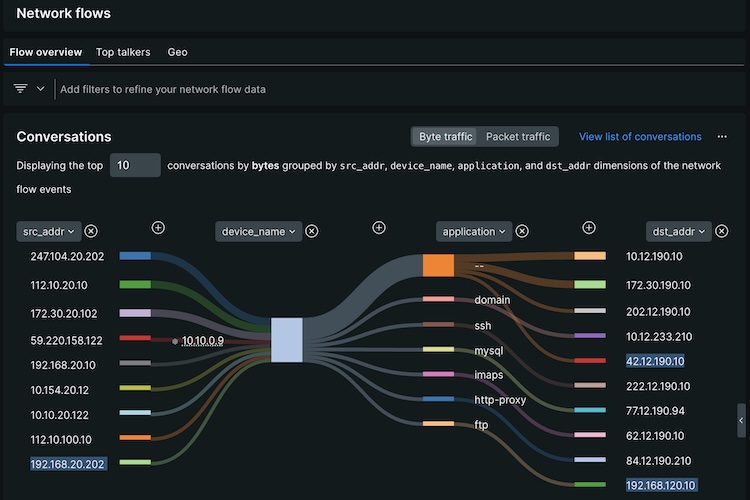
Network Flow Monitoring
**Step 1: Install ktranslate agent ** To set up network flow monitoring, run another ktranslate container specifically configured for handling network flow data:
docker run -d --name knetflow --restart unless-stopped --net=testnet \
  -v `pwd`/snmp-base.yaml:/snmp-base.yaml \
  -e NEW_RELIC_API_KEY=$NR_LICENSE_KEY \
  kentik/ktranslate:v2 \
    -snmp /snmp-base.yaml \
    -nr_account_id=$NR_ACCOUNT_ID \
    -metrics=jchf \
    -log_level=debug \
    -tee_logs=true \
    -flow_only=true \
    -nf.source=netflow5 \
    -listen=0.0.0.0:8283 \
    -metalisten=0.0.0.0:8284 \
    -nr_region=$NR_REGION \
    nr1.flow
Step 2: Inspect your network and find your flow monitoring agent address
Take a moment to inspect your Docker network setup again:
docker network inspect testnet
Step 3: Simulate Network Flow
Launch a network flow simulation device using the following command, which generates NetFlow data for testing purposes:
docker run -d --name=flow-device --restart=always --network=testnet --privileged networkstatic/nflow-generator -t 10.10.0.8 -p 9995
Step 4: Inspect the netflow logs to verify data collection and processing:
docker container logs knetflow -f
By following these steps, you will have successfully set up a comprehensive network monitoring solution using New Relic. Monitor both SNMP and network flow data effectively, ensuring optimal performance and insightful analytics for your network infrastructure.
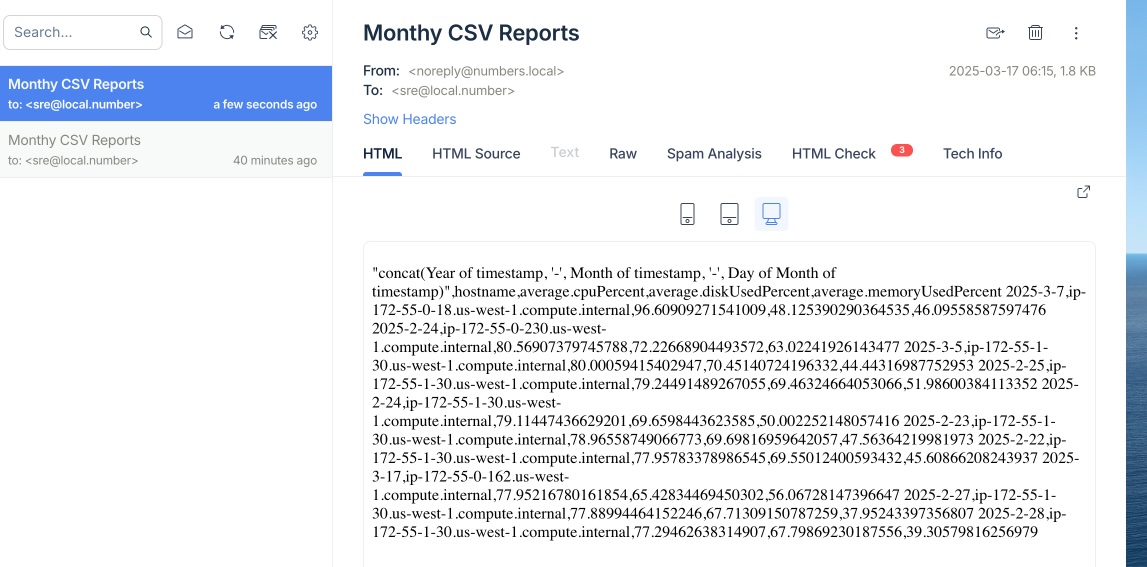 Customize & Schedule and Your Report with New Relic Reporting