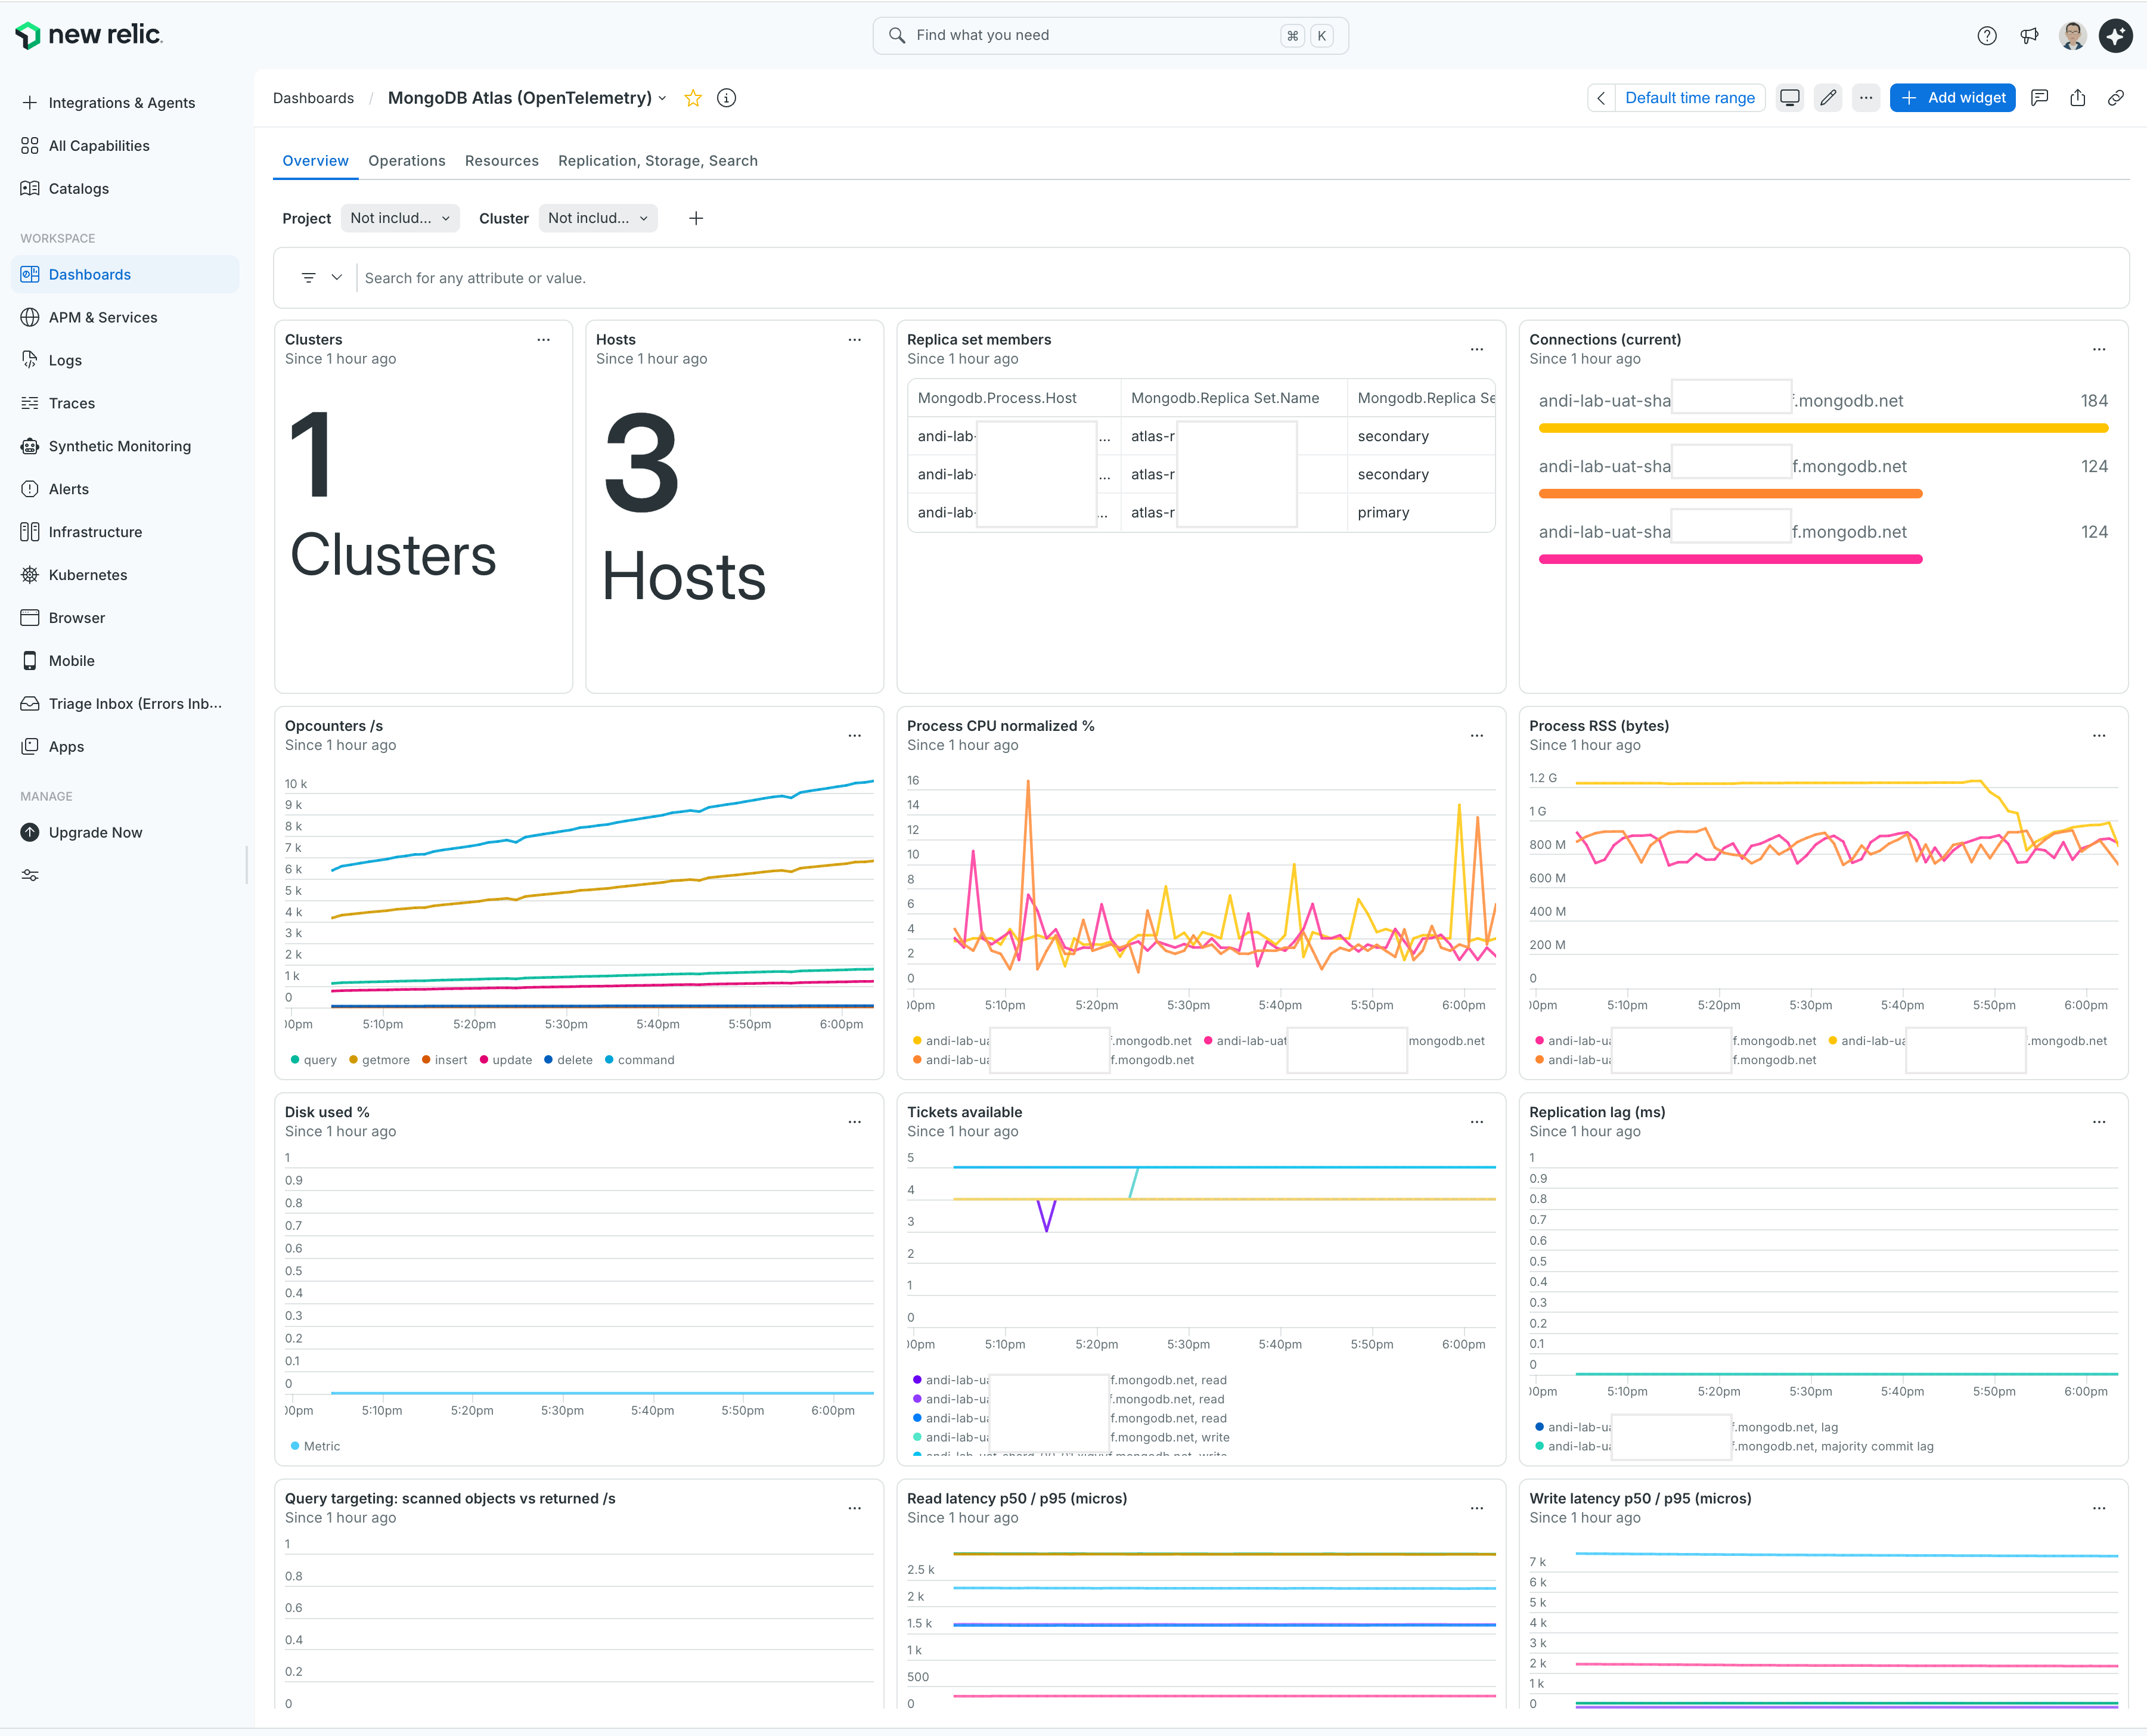
Atlas can push its metrics to New Relic directly now. You don’t need a collector or a script that polls the Atlas API. You put a New Relic license key into the Atlas integrations page and the metrics show up about a minute later.
This post is about metrics only. I’ll go through the Atlas setup, the New Relic setup, what the data looks like when it arrives, and a dashboard JSON you can import.
In short:
- Grab a New Relic license key.
- Add the OpenTelemetry integration in Atlas, pick New Relic, paste the key.
- Query
FROM Metric WHERE metricName LIKE 'mongodb.%'to confirm data. - Import the dashboard JSON.
What you need
| Item | Detail |
|---|---|
| Atlas cluster | Dedicated tier, M10 or above. Flex and shared tiers don’t emit the metrics stream. |
| Atlas role | Project Owner on the project. Organization Owners have to add themselves to the project as Project Owner first. |
| New Relic account | Any paid or free account. You need the account ID (shown in the URL and under account settings) and a license key. |
| New Relic key | A license key (ingest key), not a user API key. The OTLP endpoint authenticates with the api-key header and only accepts license keys. |
| Network | Nothing to open. Atlas pushes outbound to New Relic’s public OTLP endpoint over TLS. |
One New Relic sink per project. If you need the same metrics in a second backend, Atlas allows one Dynatrace sink and two custom OTLP sinks alongside it.
Step 1: get the New Relic license key
In New Relic, open the account dropdown (bottom left), then API keys. Create a key of type Ingest - License, or copy an existing one. It starts with a short prefix and ends in NRAL.
That’s the only key you need.
Step 2: add the OpenTelemetry integration in Atlas
- In Atlas, pick the project, then Project Settings (the gear next to Project Overview).
- Open the Integrations tab.
- On the OpenTelemetry card, click Configure.
- Under integration type, choose New Relic.
- Paste the license key and select the New Relic region (US or EU).
- Click Test. Atlas sends a single test metric named
mongodb.atlas.groupId.<projectId>.integration.testso you can confirm the key works before saving. - Click Save.
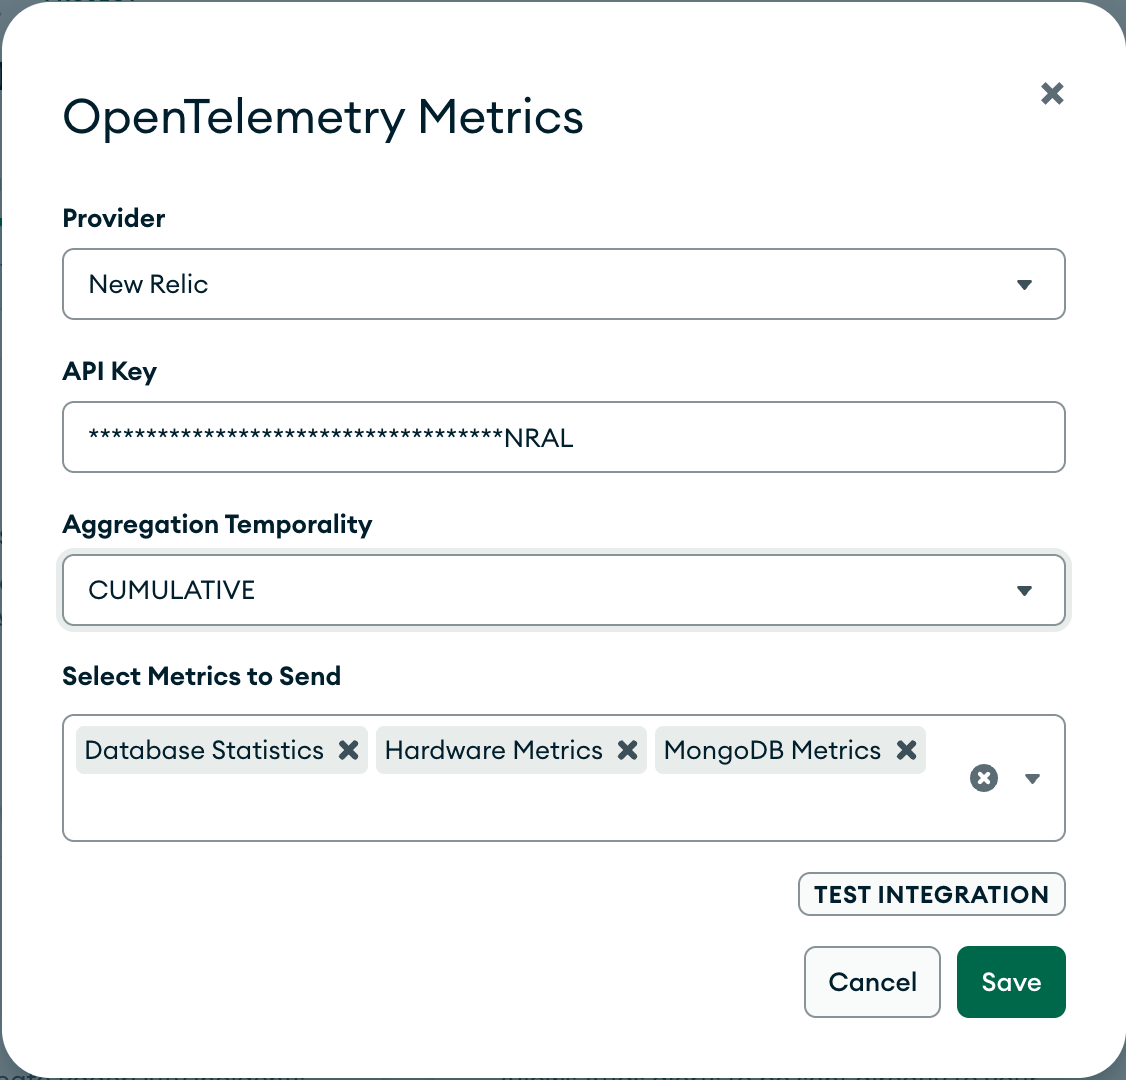
That’s it on the Atlas side. Every mongod and mongos in the project sends metrics once a minute. There’s no per-cluster switch and nothing to install.
If you want the metrics to go through your own collector first (to add attributes, drop metrics, or send to more than one backend), choose Custom instead and enter the collector’s public HTTPS OTLP endpoint and any headers it needs. Atlas only connects to public IPs with a public CA certificate, so a self-signed collector won’t pass validation.
Step 3: confirm the data in New Relic
Open the query builder in New Relic and run:
FROM Metric SELECT uniqueCount(metricName)
WHERE metricName LIKE 'mongodb.%' SINCE 10 minutes ago
You should see a few hundred metric names within two minutes of saving the integration. To list them:
FROM Metric SELECT uniques(metricName, 1000)
WHERE metricName LIKE 'mongodb.%' SINCE 1 hour ago
And to see which attributes come along, which you will need for the dashboard filters:
FROM Metric SELECT keyset()
WHERE metricName LIKE 'mongodb.%' SINCE 1 hour ago
If nothing shows up, check the key first. The Atlas form accepts a user API key or a browser key, but New Relic’s OTLP endpoint rejects them. Run Test in Atlas again and look for the test metric:
FROM Metric SELECT latest(metricName)
WHERE metricName LIKE 'mongodb.atlas.groupId.%' SINCE 1 hour ago
What arrives
About 500 metrics per process. They are the same numbers you see in the Atlas metrics tab, named after the serverStatus and hardware fields they come from.
| Namespace | What’s in it | Examples |
|---|---|---|
mongodb.server_status.* |
serverStatus output: opcounters, connections, WiredTiger cache, tickets, cursors, asserts, network, op latencies | mongodb.server_status.opcounters.query, mongodb.server_status.connections.current |
mongodb.hardware.* |
Host level: CPU, memory, disk, network, swap, pressure stall | mongodb.hardware.process.cpu.normalized_user_percent, mongodb.hardware.disk.space_used_percentage |
mongodb.derived.* |
Values Atlas computes for you: replication lag, oplog window, p50/p95 op latencies, failed command rate | mongodb.derived.replstatus.lag_milliseconds, mongodb.derived.server_status.op_latencies.reads.micros.p95 |
mongodb.repl_status.* |
Replica set state and optimes | mongodb.repl_status.my_state |
mongodb.search.* |
Atlas Search: JVM memory, index size, query and indexing counters | mongodb.search.index_stats_query_total_queries |
Every metric carries these resource attributes, which is what you filter and group on:
mongodb.project.name,mongodb.project.idmongodb.cluster.namemongodb.process.host,mongodb.process.port,mongodb.process.typemongodb.replica_set.name,mongodb.replica_set.state(PRIMARY, SECONDARY)mongodb.node.type,mongodb.instance.tier,mongodb.versioncloud.provider,cloud.region,cloud.availability_zone
One thing to watch. Most of mongodb.server_status.* comes in as a gauge, including the counters. opcounters.query is a running total since the process started, but New Relic stores it as a gauge, so sum() and rate(sum()) give wrong numbers. Use derivative() to get a per-second rate:
FROM Metric
SELECT derivative(`mongodb.server_status.opcounters.query`, 1 second) AS 'queries/s'
WHERE `mongodb.cluster.name` = 'my-cluster'
FACET `mongodb.process.host` TIMESERIES
Two notes on that query. Put metric names with dots in backticks inside derivative(). And derivative() needs at least two points per bucket. Atlas sends one sample a minute, so set the time picker to a few hours or the chart stays empty.
The hardware counters (mongodb.hardware.disk.read_count, the CPU millisecond counters, mongodb.derived.commands.*, the search counters) do come in as real cumulative counters. For those, rate(sum(...), 1 second) works as expected.
Step 4: import the dashboard
New Relic dashboards import from JSON: Dashboards > Import dashboard, paste, pick the account. The full file is four pages and 70 widgets (Overview, Operations, Resources, Replication/Storage/Search). Here is a cut-down version with one widget and one filter variable:
{
  "name": "MongoDB Atlas (OpenTelemetry)",
  "permissions": "PUBLIC_READ_WRITE",
  "pages": [
    {
      "name": "Overview",
      "widgets": [
        {
          "title": "Opcounters /s",
          "layout": { "column": 1, "row": 1, "width": 4, "height": 3 },
          "visualization": { "id": "viz.line" },
          "rawConfiguration": {
            "facet": { "showOtherSeries": false },
            "legend": { "enabled": true },
            "nrqlQueries": [
              {
                "accountId": <YOUR_ACCOUNT_ID>,
                "query": "FROM Metric SELECT derivative(`mongodb.server_status.opcounters.query`, 1 second) AS 'query', derivative(`mongodb.server_status.opcounters.insert`, 1 second) AS 'insert', derivative(`mongodb.server_status.opcounters.update`, 1 second) AS 'update', derivative(`mongodb.server_status.opcounters.delete`, 1 second) AS 'delete' WHERE `mongodb.project.name` IN ({{project}}) AND `mongodb.cluster.name` IN ({{cluster}}) FACET `mongodb.process.host` TIMESERIES AUTO"
              }
            ],
            "platformOptions": { "ignoreTimeRange": false },
            "yAxisLeft": { "zero": true }
          }
        }
      ]
    }
  ],
  "variables": [
    {
      "name": "cluster",
      "title": "Cluster",
      "type": "NRQL",
      "isMultiSelection": true,
      "replacementStrategy": "DEFAULT",
      "nrqlQuery": {
        "accountIds": [<YOUR_ACCOUNT_ID>],
        "query": "FROM Metric SELECT uniques(`mongodb.cluster.name`, 1000) SINCE 1 day ago"
      },
      "options": { "ignoreTimeRange": true, "excluded": true }
    }
  ]
}
If you build your own:
- Use your real account ID in
accountId. The importer rejects0andnull. Every widget and every variable carries it. - Variables with
excluded: truestart switched off, so the dashboard shows every cluster until you turn the filter on. UseIN ({{cluster}})rather than=so multi-select works. - Facet by host.
derivative()is worked out per series, so mixing hosts in one series gives wrong numbers. AddFACET mongodb.process.hostto anything that uses it.
You can download the full JSON here: mongodb-atlas-otel-dashboard.json